
- Decisions Start With Data
Pharma Analytics,
Delivered Live.
Gain real-time visibility into counter sales, profit margins, fast and slow moving inventory, and outstanding dues from one unified dashboard.
Your dashboard tells you more than today's sales
A pharmacy generates thousands of data points. You shouldn't have to dig through them to understand your business.
Every sale, purchase, payment, and stock movement adds to your business data.
MediFlux brings the important signals together so you can quickly see what needs your attention.
Zero Report Fatigue
Open your dashboard and get a snapshot of your business without opening five different reports.
Data Generated Every Day
Counter Sales
Every retail bill & discount logged live
Supplier Purchases
Inward stocks, batch rates & credit lines
Customer Payments
Cash, UPI, split cards & udhaar receipts
Stock Movements
Dispenses, returns, damages & expirations
Single Live Canvas
Instant Business Health Snapshot
Always Up to Date
What do you want to know?
Every business decision starts with a clear question. MediFlux is built to give you instant, unambiguous answers without spreadsheet acrobatics.
Are sales moving up or down?
See your sales activity and trends instead of looking at individual bills.
What's selling the most?
Identify your top-selling medicines and products.
What's moving slowly?
Spot fast-moving and slow-moving medicines so you can understand how your inventory is performing.
Who still owes you?
See outstanding payments and customer dues without manually adding them up.
What's happening with your stock?
Keep an eye on inventory health, including out-of-stock and expired medicines.
Where is the money going?
Use your financial and transaction data to understand revenue, expenses, and profitability.
Natively Surfaced: The primary five views are explicitly built into the core MediFlux dashboard documentation.
Everything important, right when you log in
Your dashboard is your business snapshot
Instead of decorative charts with no practical purpose, MediFlux gives you the six exact intelligence views every pharmacy owner needs to make immediate, confident decisions.
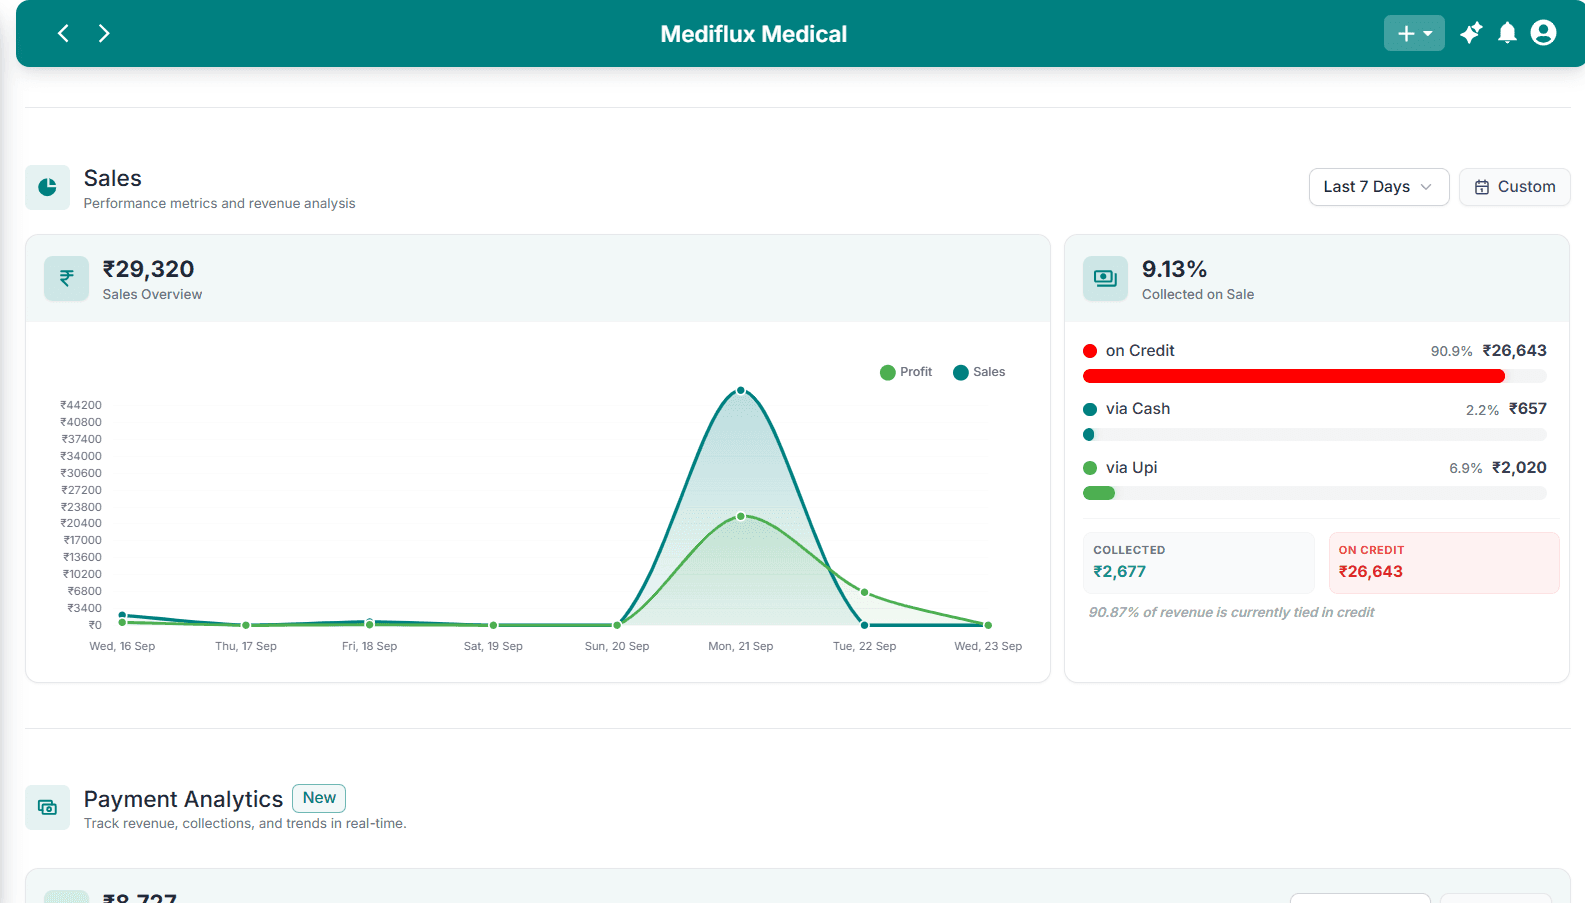
Sales Analytics
Understand sales activity and trends.
Know whether your revenue is accelerating or softening week over week.
Payment Distribution
See how your payments are distributed.
Track cash in hand vs. UPI/Card vs. credit (udhaar) in real time.
Top-Selling Drugs
Know which medicines are contributing most to your sales.
Never get caught off-guard by unexpectedly high-demand prescription lines.
Fast & Slow Moving Medicines
Understand which products are moving quickly and which ones are sitting longer.
Protect your working capital from sitting idle in stagnant batches.
Out-of-Stock Medicines
See products that need attention before a customer asks for them.
Proactively generate purchase requisitions before missing customer walk-ins.
Expired Medicines
Keep expired stock visible so it doesn't get overlooked.
Process distributor credit notes and returns before deadlines elapse.
MediFlux's documentation specifically describes each of these native dashboard views.
Don't just look at the number. Look at the pattern.
One day's sales can be misleading. Trends tell you more.
A good day doesn't necessarily mean your business is growing.
A slow day doesn't necessarily mean something is wrong.
The useful part is seeing how your numbers change over time.
MediFlux's analytics are designed to help you look beyond individual transactions and understand trends in your business.
Pharmacy Sales & Profit Trendline
Rolling 30-Day Velocity
Sales today is a number.
Sales over time is information.
Your inventory is telling you something too
What sells. What sits. What runs out.
Your sales and inventory data are connected.
That means your analytics can help you see the relationship between what customers are buying and what is sitting on your shelves.
High-Velocity Stock
A medicine that moves quickly needs a different approach from one that barely moves.
Repeated Stockouts
A product that's repeatedly out of stock needs attention before customers walk away.
Expired Stagnancy
And expired stock tells you something about inventory that isn't moving as it should.
Live Dashboard Perspectives
Real Dashboard Crops & Telemetry
Augmentin 625 Duo
GSK Pharma
Dolo 650mg Tab
Micro Labs
Azithral 500mg
Alembic Pharma
Aciloc RD Tab 20
KHAN Medical
Omnic Ocas 0.4mg
Astellas
Cipcal HD Strip
Cipla
AUGMENTIN 375MG
KHAN Medical
Amoxicillin
Healthcare Store
Dolo 650
Aay Aar Enterprise
The dashboard surfaces fast and slow-moving medicines, out-of-stock medicines, and expired stock so these signals are easier to spot.
From overview to detail
See the signal, then investigate it
The dashboard is your starting point, not the entire analysis.
If something catches your attention, MediFlux gives you the underlying areas of the system where you can investigate further.
This is important because we shouldn't pretend the dashboard itself answers every business question. It gives you the overview, then the rest of MediFlux gives you the detail.
For owners who can't watch everything
You don't need to stand at the counter to know what's happening
As a pharmacy grows, the owner can't personally watch every sale, payment, purchase, and stock movement.
The dashboard gives you a quick way to check the business without reconstructing everything from individual transactions.
Open MediFlux and see the current picture:
What is selling.
Daily counter volume, top brands, prescription throughput.
What needs attention.
Out-of-stock items, upcoming expirations, customer disputes.
What's moving.
Fast velocity lines vs. stagnant boxes taking up shelf space.
What's outstanding.
Customer udhaar dues and distributor balance timelines.
Business Analytics that comes from your actual business
No separate data entry. No separate analytics system.
The data is already being created as you run your pharmacy. You don't need an external BI team or extra administrative hours.
You make a sale.
MediFlux records it.
Tax, margin, batch deductions logged instantly at billing.
You receive a payment.
MediFlux records it.
Cash drawer, bank ledger, and customer udhaar updated.
You purchase stock.
MediFlux records it.
Inward quantities, landed cost, and supplier dues captured.
A medicine moves out.
MediFlux records it.
Stock velocity recalculates automatically across all racks.
Your analytics build from that activity.
So the dashboard isn't asking your team to maintain another system just to produce reports.
1. You
Run the pharmacy.
2. System
MediFlux keeps the data.
3. Intelligence
The dashboard explains it.
Know more than what you sold today.
See the numbers, trends, products, payments, and stock signals that tell you how your pharmacy is performing.
Business Analytics FAQs
Common questions about dashboard visibility, live updates, and performance metrics in MediFlux.